


Every four years, the United States buzzes with political activity. From campaign rallies to televised debates, the presidential election cycle takes center stage. For investors, this period often brings a mix of excitement and uncertainty. You might find yourself wondering how the stock market will react to the political drama. Understanding the election year stock market history can provide valuable context, helping you navigate these times with a clearer perspective.
While past performance is never a guarantee of future results, looking at historical data can reveal interesting patterns. The market often behaves in specific ways during different phases of a presidential term. This phenomenon is frequently discussed as the 4-year presidential cycle stock market theory. By exploring these trends, you can gain insights into how political shifts have historically influenced market performance and what it might mean for your investment strategy.
Key Takeaways
- Historically, U.S. stock markets have often performed well during election years, though with increased volatility.
- The third year of a presidential term has historically been the strongest for the stock market, while the first two years tend to be weaker.
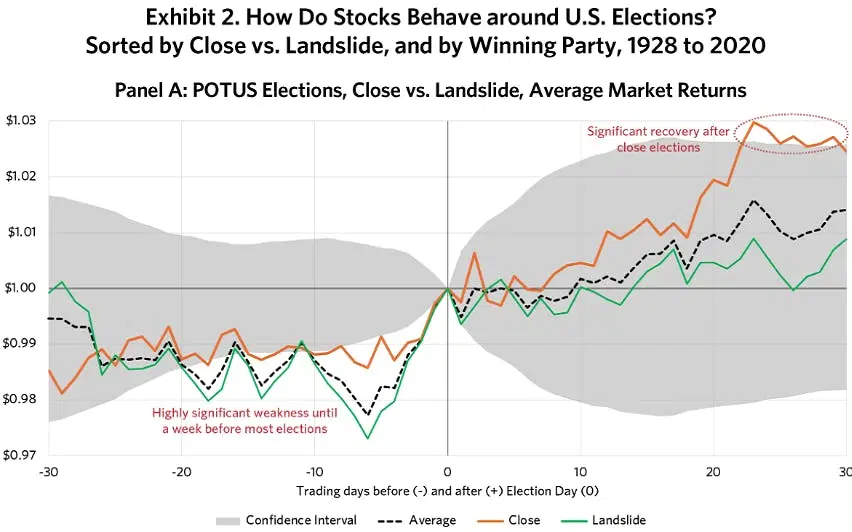
- Market uncertainty can increase in the months leading up to an election, but it often subsides once the results are clear.
- The political party in power has historically had less impact on long-term market performance than the broader economic conditions.
- Focusing on long-term goals and a diversified portfolio is a sound strategy, regardless of the election cycle.
Unpacking the 4-Year Presidential Cycle Stock Market Theory
The idea that presidential terms influence the stock market is not new. The 4-year presidential cycle stock market theory suggests a predictable pattern tied to the president’s term. This theory, first popularized by Yale Hirsch of the Stock Trader’s Almanac, breaks down the four-year term into distinct phases, each with its own typical market behavior.
The core idea is that presidents may take actions early in their term that are initially unpopular but are aimed at long-term economic health. As the next election approaches, the focus often shifts to more stimulative policies to boost the economy and improve voter sentiment, which can positively impact the market. This creates a cycle where the market’s performance can ebb and flow with the political calendar.
The First Two Years: The “Presidential Honeymoon” and Midterm Slump
The first year of a presidential term often involves the new administration focusing on fulfilling campaign promises and tackling difficult legislative challenges. This can create economic uncertainty, and as a result, the market historically sees more modest gains. The second year, which includes the midterm elections, has traditionally been the weakest of the four. During this time, the focus is on congressional races, which can lead to political gridlock and further market hesitation. Investors may adopt a “wait and see” approach as they gauge the new political landscape. This period is often characterized by lower returns as the administration’s initial policies take time to show results and the political focus shifts to the midterms.
The Third Year: The Pre-Election Sweet Spot
Historically, the third year of a presidential term is the strongest for the stock market. According to the 4-year presidential cycle stock market theory, this is when the incumbent party begins to focus on reelection. The administration may push for pro-growth policies, such as tax cuts or increased government spending, to stimulate the economy and create a positive environment for voters. With the difficult decisions of the first two years behind them, presidents often use this year to ensure the economy is on solid footing. This has often translated into strong market returns, making it the most profitable year of the cycle for investors, according to historical data.
The Fourth Year: The Election Year Effect
The fourth year of the term, the election year itself, tends to be positive for the stock market, though not typically as strong as the third year. This performance is often driven by continued efforts to maintain economic stability and voter confidence. However, election years also bring a unique set of variables. Market volatility can increase as election day nears, especially if the race is tight. Investors react to polls, debate performances, and policy proposals from both candidates. Understanding the nuances of election year stock market history helps investors prepare for this potential turbulence while recognizing the underlying positive trend.
A Historical Look at Election Year Market Performance
When we examine the election year stock market history, a clear pattern emerges: markets tend to finish the year in positive territory. Data going back decades shows that the S&P 500 has, on average, posted solid gains during presidential election years. This trend holds true across different political parties and economic backdrops. For instance, since 1952, the S&P 500 has had a positive return in the majority of election years. This is not to say that every election year is smooth sailing. Short-term volatility is a common feature as investors digest new information and speculate on the outcome.
The reason for this positive trend is often attributed to the incumbent party’s desire to keep the economy strong. A healthy economy and a rising stock market can be powerful tools for a party seeking to retain power. As such, administrations may avoid making drastic policy changes that could disrupt the market in the months leading up to November. While a close race can introduce uncertainty, the market often rallies after the election is decided, regardless of who wins. This “clarity rally” occurs as the uncertainty that weighed on the market is finally removed.
Do Different Parties Mean Different Market Outcomes?
A common question for investors is whether the market performs better under a Democratic or Republican president. The data on this topic is complex and often debated. Some studies suggest that the market has historically performed better under Democratic administrations, while others point to periods of strong growth under Republicans. However, a deeper dive into the election year stock market history reveals that the president’s party is likely less important than the broader economic context. Factors like inflation, interest rates, and global events often have a much larger impact on market returns than the political affiliation of the person in the White House.
For example, a president who inherits a strong, growing economy is more likely to preside over a rising market than one who takes office during a recession. Instead of focusing on which party will win, savvy investors often pay more attention to the specific policies being proposed. Issues like tax reform, trade agreements, and regulation can have a direct impact on corporate earnings and, by extension, stock prices. For further reading on economic trends, you might find valuable insights from global sources like those discussed at https://siliconvalleytime.co.uk/.
Volatility: The Inevitable Companion of Election Years
While the overall trend for election years has been positive, it’s crucial to acknowledge the role of volatility. In the months leading up to an election, the market can become a roller coaster. This is because markets dislike uncertainty, and a presidential election is one of the biggest sources of uncertainty there is. Investors are trying to price in two very different potential outcomes, each with its own set of proposed policies and economic implications. This can lead to significant price swings as polls shift and news breaks.
This heightened volatility is a key part of the election year stock market history. It’s important for investors not to be shaken by these short-term movements. Panicking and selling during a downturn is often the worst thing you can do. Instead, viewing volatility as a normal part of the election cycle can help you maintain a long-term perspective. Once the election is over and the path forward becomes clearer, this volatility tends to subside.
Navigating Volatility: A Practical Approach
So, how can you prepare for election year volatility?
- Stay Diversified: A well-diversified portfolio is your best defense. Spreading your investments across different asset classes (stocks, bonds, etc.) and sectors can help cushion the blow if one part of the market experiences a downturn.
- Focus on the Long Term: Avoid making rash decisions based on short-term political news. Remember that your investment strategy should be aligned with your long-term financial goals, not the latest poll numbers.
- Rebalance Your Portfolio: An election year can be a good time to review your portfolio and ensure it’s still aligned with your risk tolerance. If market swings have pushed your asset allocation out of balance, consider rebalancing back to your target mix.
- Stay Informed, Not Obsessed: Keep up with the economic policies being proposed, but don’t get caught up in the day-to-day political drama. Focus on how potential policies could impact specific industries or the economy as a whole.
Key Market Sectors to Watch During an Election
During an election year, certain market sectors can come under the spotlight depending on the candidates’ platforms. The proposed policies on healthcare, energy, technology, and defense can create both opportunities and risks for investors in those areas. For example, a candidate promising to expand renewable energy initiatives could boost stocks in the solar and wind power industries. Conversely, a candidate proposing stricter regulations on big tech could create headwinds for that sector.
Understanding the candidates’ stances on key issues is crucial. If one party has a strong focus on infrastructure spending, companies in the construction and materials sectors might see increased interest from investors. Similarly, discussions around drug pricing can have a significant impact on pharmaceutical and biotech stocks. By paying attention to these policy debates, you can get a better sense of which sectors might be most affected by the election’s outcome. This is a practical application of understanding the nuances within the broader election year stock market history.
Post-Election Market Trends
What happens after the votes are counted? Historically, the market’s reaction in the immediate aftermath of an election can be mixed. Sometimes, there is a “relief rally” as the uncertainty is resolved. Other times, the market may dip if the outcome is a surprise or if investors are concerned about the winning candidate’s policies. However, looking at the months following an election, the market typically finds its footing and resumes its long-term trend.
The period between the election in November and the inauguration in January can also be a time of adjustment. The market begins to price in the policies of the new administration. The focus shifts from campaign promises to the reality of governing. Over the long run, corporate earnings and economic fundamentals tend to be the primary drivers of stock prices, and the political noise of the election eventually fades into the background.
|
Presidential Term Year |
Average S&P 500 Performance (Historical) |
Key Characteristics |
|---|---|---|
|
Year 1 |
Modest Gains |
New administration, policy uncertainty, legislative battles. |
|
Year 2 |
Weakest Performance |
Midterm elections, potential for political gridlock, market hesitation. |
|
Year 3 |
Strongest Performance |
Focus on reelection, pro-growth policies, economic stimulus. |
|
Year 4 (Election) |
Positive, but with Volatility |
Incumbent seeks stability, increased uncertainty, market rallies post-clarity. |
Conclusion: Investing with Confidence in an Election Year
The election year stock market history teaches us that while politics can create short-term noise and volatility, the market has shown remarkable resilience over the long term. The 4-year presidential cycle stock market theory provides a useful framework for understanding potential trends, but it should not be the sole basis for your investment decisions. Economic fundamentals, corporate earnings, and global events will always play a critical role in shaping market performance.
The most effective strategy for navigating an election year is the same one that works in any other year: stay disciplined, maintain a diversified portfolio, and focus on your long-term financial goals. Don’t let the political headlines derail your investment plan. By understanding the historical context and staying focused on what you can control, you can invest with confidence, no matter who occupies the White House.
Frequently Asked Questions (FAQ)
Q1: Should I sell my stocks before a presidential election?
A1: Generally, no. Trying to time the market is extremely difficult and often leads to poor outcomes. Historical data shows that selling out of fear during an election year could mean missing out on potential gains, as election years have often ended positively for the market. A better approach is to stick with your long-term investment plan.
Q2: Does the stock market perform better with a specific political party in power?
A2: While some analyses show slight performance differences, there is no conclusive evidence that one party is consistently “better” for the stock market. Economic conditions like interest rates, inflation, and global growth tend to be far more influential than the president’s political party.
Q3: How does the 4-year presidential cycle stock market theory work?
A3: This theory suggests a pattern where the first two years of a presidential term are weaker for the market due to policy uncertainty and midterm elections. The third and fourth years are typically stronger as the incumbent administration often pushes pro-growth policies to improve the economy ahead of the next election.
Q4: What is the most volatile period during an election year?
A4: Market volatility often peaks in the months leading up to the election, particularly in September and October, when uncertainty about the outcome is at its highest. This volatility usually subsides once the election results are clear.
Q5: Should I change my investment strategy based on election predictions?
A5: It’s not advisable to make major changes to your investment strategy based on election polls or predictions. Instead, focus on building a resilient and diversified portfolio that can withstand political and economic shifts over the long term. Your strategy should be based on your personal financial goals and risk tolerance.